Week 1: Signals in Python
Python Basics
Variables
Variables in python are very flexible, unlike C++:
- Interpreted language.
- No need to declare the variable type.
- The same variable can be assigned to different types.
x = 5
y = 'Hello SBME'
z = 5
z = "Hello SBME"
Lists
# List construction
subjects = ['DSP','Computer Graphics']

# Append an element
subjects.append('Biochemistry')

# Append another list
subjects.extend(['Bioelectronics','Clinical'])

print( subjects ) # ??
print( subjects[0] ) # ??
print( subjects[1] ) # ??
Arithmetic Operations
x = 19
y = 18

z = x / y
z = x * y
z = x + y
z = x - y
Logical Opertations
x = 17 % 2 == 1

y = 9 / 3 < 1

b = x or y ## True

b = x and y ## False
-
and=>&&in C++ -
or=>||in C++
If, elif, else
x = 23
y = 22

if x < y:
  z = 13 # Local scope

elif x % 2 == 1 and x > y :
  h = 17 # Local scope

else:
  v = 80 # Local scope

print( z ) # Error: z is out of scope
print( h ) # Error: h is out of scope
Loops
for i in range(10):
  print( i )

i = 0
while i < 10 :
  print( i )
  i += 1
Functions
def mean( list ):
  sum = 0
  for element in list:
    sum += element
  return sum / len( sum )

m = mean([1,12,42,1,23,12])
print( m )
Importing Libraries
import numpy as np
import scipy as sp
Numpy
Reference: NumPy Reference
import numpy as np

a = np.array([12,23,44,21,23])

print( np.mean( a ))
print( np.std( a ))
Scipy & Matplotlib
from scipy import signal
import matplotlib as mpl
import matplotlib.pyplot as plt
import numpy as np

sig = np.repeat([0., 1., 0.], 100)

highpass = [-1,0,1]
hanning = signal.hann(50)

filtered_hanning = signal.convolve(sig, hanning)
filtered_highpass = signal.convolve(sig, highpass)


## Plotting

mpl.style.use('seaborn')

plt.figure(1)
plt.subplot(311)
plt.plot( sig , lw = 2 )

plt.subplot(312)
plt.plot( filtered_highpass , lw = 2 )

plt.subplot(313)
plt.plot( filtered_hanning , lw = 2 )
Plotly - Dash
- Web based visualization.
- Many features.
- Declarative Style.
- Web-based visualization.
Declarative Programming
This snippet is from Dash by plotly
import dash
from dash.dependencies import Input, Output
import dash_core_components as dcc
import dash_html_components as html
from pandas_datareader import data as web
from datetime import datetime as dt

app = dash.Dash()

app.layout = html.Div([
    html.H1('Stock Tickers'),
    dcc.Dropdown(
        id='my-dropdown',
        options=[
            {'label': 'Coke', 'value': 'COKE'},
            {'label': 'Tesla', 'value': 'TSLA'},
            {'label': 'Apple', 'value': 'AAPL'}
        ],
        value='COKE'
    ),
    dcc.Graph(id='my-graph')
])

@app.callback(Output('my-graph', 'figure'), [Input('my-dropdown', 'value')])
def update_graph(selected_dropdown_value):
    df = web.DataReader(
        selected_dropdown_value, data_source='google',
        start=dt(2017, 1, 1), end=dt.now())
    return {
        'data': [{
            'x': df.index,
            'y': df.Close
        }]
    }

if __name__ == '__main__':
    app.run_server()
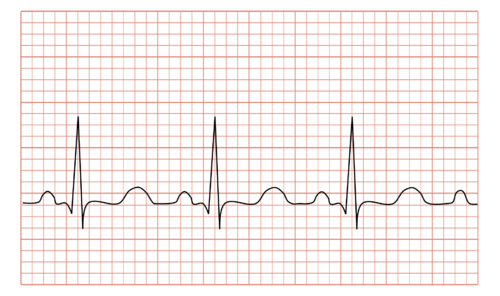
Signals: Examples
Electrocardiography (ECG)
Electroencephalography (EEG)
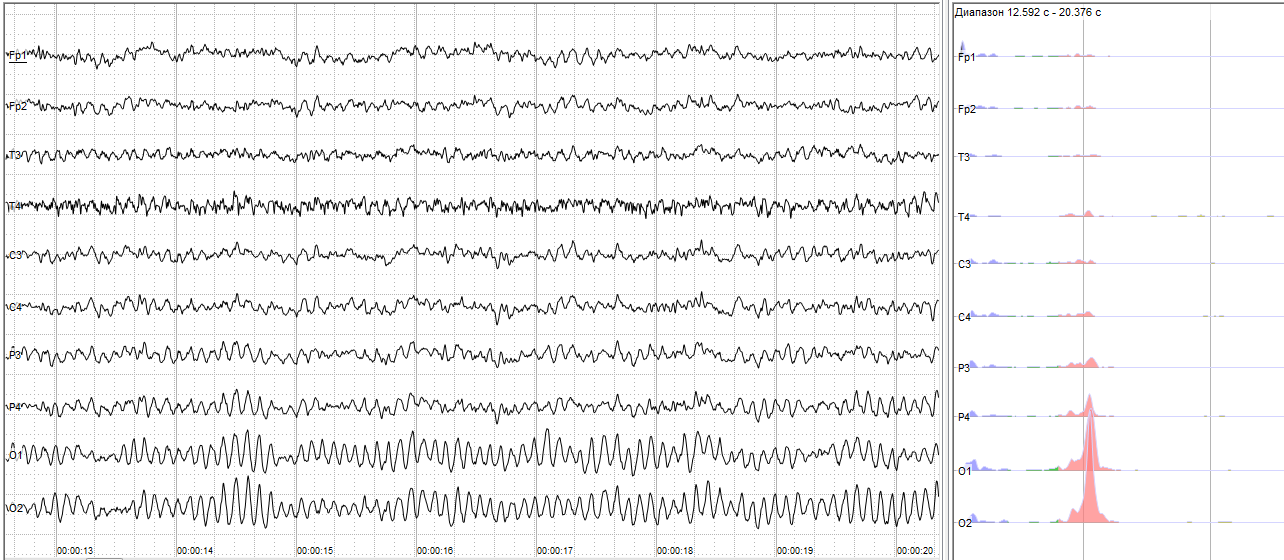
CC BY-SA 4.0 (by Andrii Cherninskyi)
Task Objective
- Signal Viewer Application.
- 3 Signals X 3 Cases.
- Live sound signal visualization from Microphone.
- Matlab or Python Implementation.
- Apply filters on your signal (convolution).
- User designed filters (windows).
Getting Started with Python: Installing Anaconda
Anaconda
- Shipped +1000 Data Science Packages (DSP, Machine Learning, AI, Statistics).
- Shipped with Python IDE (Spyder).
- Shipped with Jupyter Notebook.