Week 8: Segmentation (Clustering Segmentation)
These notes are inspired by slides made by TA Eng.Mohamed Hisham
Clustering Segmentation
Clustering is the process of grouping similar data points together and marking them as a same cluster or group. It is used in many fields including machine learning, data analysis and data mining. We can consider segmentation as a clustering problem. We need to cluster image into different object, each object’s pixels has common features for example same color or same intensity.
Talking about similarity criteria takes us to what so-called feature. A feature is a value that measures or identify characteristic of a subject, it must discriminate between different subjects. One of important rules in machine learning is that Good feature with simple classifier is more accurate than bad feature with robust classifier.
Feature space is an alternative space of ordinary data space. Its coordinates are feature values and each data point is represented by its value of different features. For example, color components R, G, and B are the coordinates of our feature space. Each pixel in the image will be represented as a 3D vector of its R, G, and B values. Working in feature space in image segmentation collects pixels with same color (feature) together even so they are isolated in image space.
K means Clustering
K means clustering Initially assumes random cluster centers in feature space. Data are clustered to these centers according to the distance between them and centers. Now we can update the value of the center for each cluster, it is the mean of its points. Process is repeated and data are re-clustered for each iteration, new mean is calculated till convergence. Finally we have our centers and its related data points. The process is shown in the following figure.
So basic Algorithm steps for k means segmentation are
Construct feature space from your image (number of data point = number of pixels)
Set number of required clusters k
Set Max number of iterations for clustering
Get random k points in your feature space (initial centers)
for i in range(max number of iterations)
    #Cluster remaining data points to centers according to distance
    for each data point:
        for each cluster:
            distances =  distance between it cluster centers
        its cluster = min(distances)
    #Calculate the new centers
    for each cluster:
        newCenter = mean(RelatedPoints)
Let’s Try to implement it
K means basic implementation
- Import some libraries
import numpy as np
import matplotlib.pyplot as plt
from matplotlib import colors
from scipy import  misc
- Function Definition
def kmeans(image, k, num_iterations, d): ''' K means clustering segmentation algorithm inputs: k : number of clusters. num_iterations : for convergence d : dimension of feature space 1, 2, or 3D ''' - Construction of feature space
#1. Construct feature space m, n = image.shape[0:2] num_points = m*n # extract_feature_space is another function (Don't care about it now) feature_space = extract_feature_space(image, d) - Getting Initial centers
idxs = np.round(num_points * np.random.rand(k)) #Boundary condition idxs[np.where(idxs >= m*n)] -= 1 initial_centers = np.zeros((d,k)) for i in range(k): initial_centers[:,i] = feature_space[:,int(idxs[i])] clusters_centers = initial_centers # Initialize distance vector distance = np.zeros((k,1)) #cluster points determines cluster of each point in space cluster_points = np.zeros((num_points, 1)) - start clustering for number of iterations
for j in range(num_iterations): #Cluster all points according min distance for l in range(num_points): #Get distance to all centers for h in range(k): distance[h] = np.sqrt(np.sum((feature_space[:,l]-clusters_centers[:,h])**2)) #Select minimum one cluster_points[l] = np.argmin(distance) # Update centers of clusters according new points for c in range(k): # Get points associated with that cluster idxs = np.where(cluster_points == c) points = feature_space[:,idxs[0]] # Get its new center clusters_centers[:,c] = np.mean(points, 1) - Back to Image Space
# extract_segmented_image is another function (Don't care about it now) segmented_image = extract_segmented_image(cluster_points, clusters_centers, image) return segmented_image - Testing
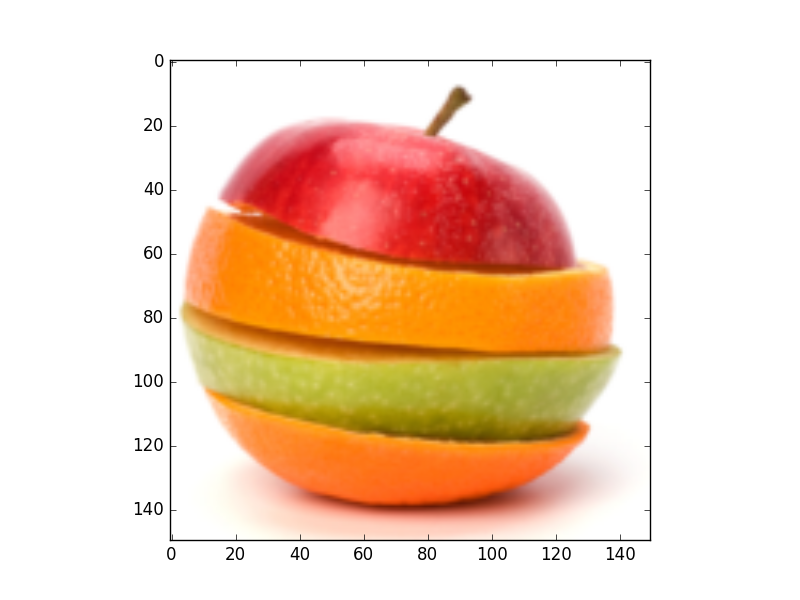
if __name__=='__main__':
  #Load the image
  image = plt.imread('images/seg3.png')
  # Rescale image down for speedup
  image = misc.imresize(image, (150,150))
  #Show original Image
  plt.figure('Original Image')
  plt.imshow(image)
  #Apply k means segmentation and show the result
  segmented_image = kmeans(image, 5,10, 1)
  plt.figure('segmented image')
  plt.set_cmap('gray')
  plt.imshow(segmented_image)
  plt.show()
K means Results
- Results for k = 5 classes
Original Image
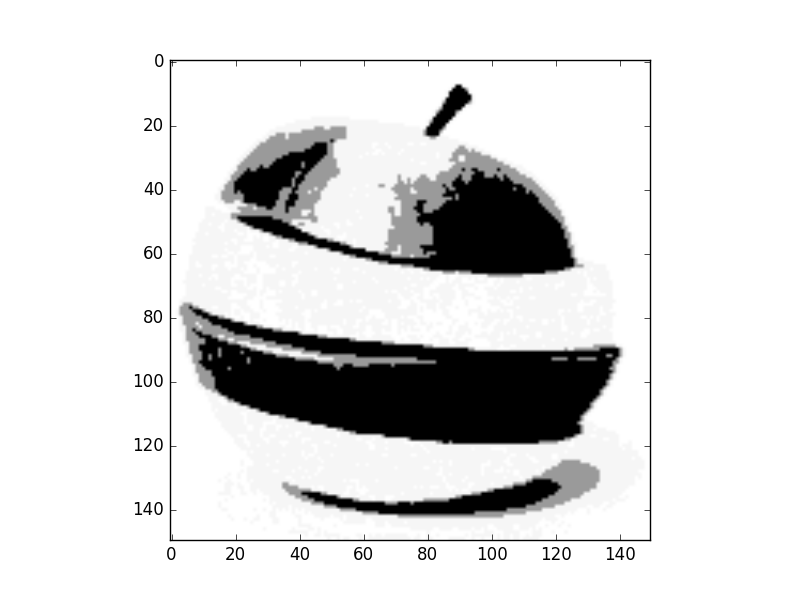
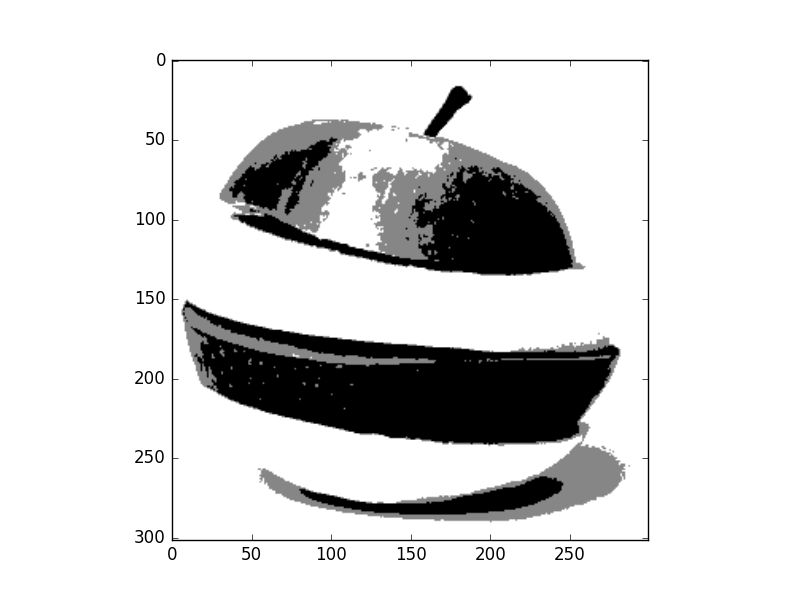
- 1D feature space (Gray level)
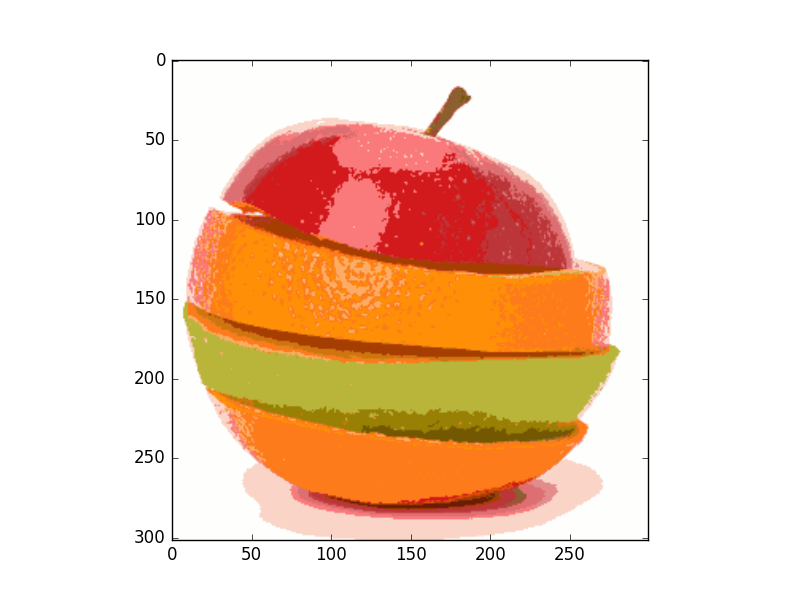
- 2D feature space (Colors HS channels)
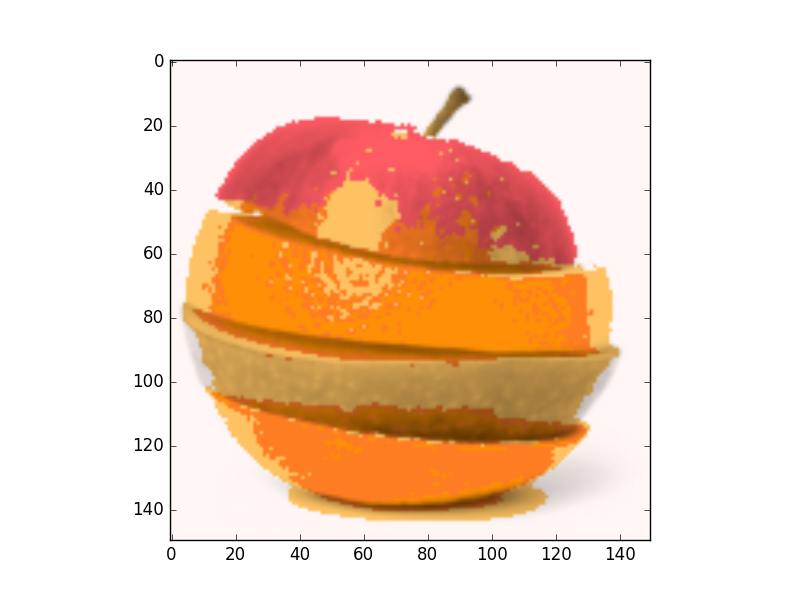
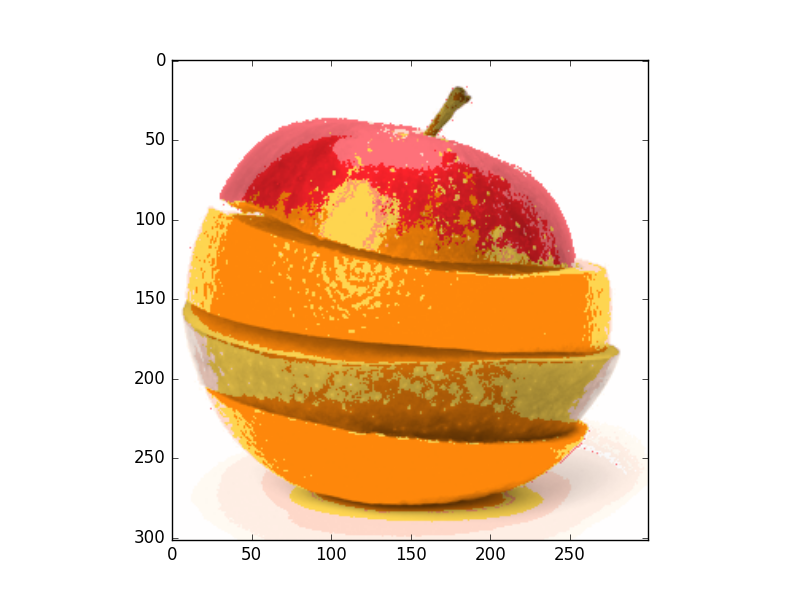
- 3D feature space (Colors RGB)
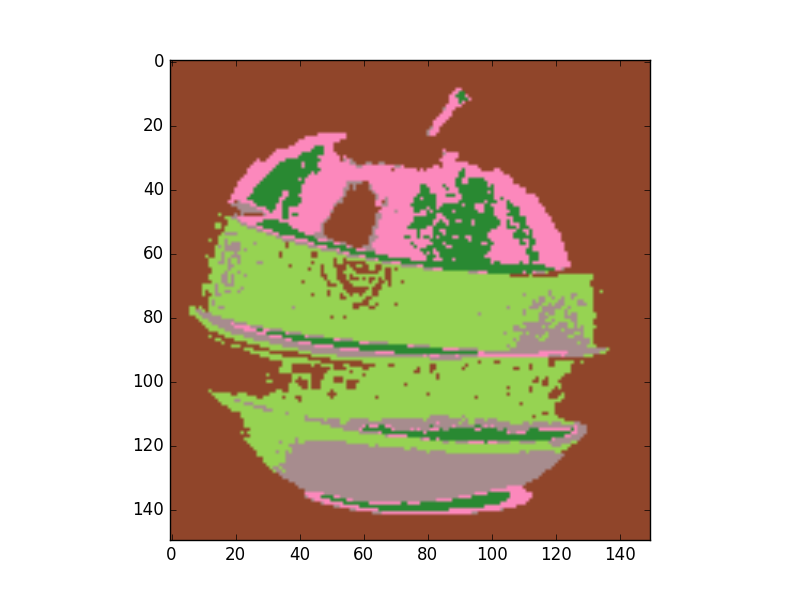
We can see that convergence in 3D space is slower so classes picked none relevant colors.
Mean shift Clustering
Mean shift clustering is a non-parametric technique for clustering, it isn’t require to specify the number of clusters. Also it is robust for outliers as clusters aren’t in spherical shape it takes a none-linear shape according to clustering procedure.
Basic algorithm
Pseudo code of basic mean shift algorithm with uniform kernel
Extract feature space from image
While number of unvisited points > 0
    Select a random point in feature space (Initial mean)
    While true:
    Get distance between mean and all points in feature space
    For uniform window, select points in the range of specified bandwidth and track that points
    Get the new mean, it is the mean of points within bandwidth
    if distance between new and old means < threshold:
        cluster all tracked points to new mean
        update number of visited points
        break
This algorithm is shown in that figure
So the process will repeated till all points in feature space are clustered.
Wait, we didn’t finish yet!
Merging clusters
One of drawbacks of uniform kernel is that center may not move for uniform regions. Merging nearby centers is the solution of such problem. Merge condition is that distance between the two centers is lower than half the bandwidth. Algorithm will be modified as follow
Extract feature space from image
While number of unvisited points > 0
    Select a random point in feature space (Initial mean)
    While true:
    Get distance between mean and all points in feature space
    For uniform window, select points in the range of specified bandwidth and track that points
    Get the new mean, it is the mean of points within bandwidth
    if distance between new and old means < threshold:
        for c in clusters:
            #Check merge condition
            if distance(c, center) < 0.5* Bandwidth:
                mean of cluster c = 0.5*distance(c,center)
                cluster all tracked points to cluster c
        #No merge
        cluster all tracked points to new mean
        #Update visited points
        update number of visited points
        break
Bandwidth selection
The effect of changing bandwidth is that number of clusters will change. Larger bandwidth tends to lower number of clusters while smaller bandwidth tends to more number of clusters.
Results of mean shift segmentation
Original Image

- 1D feature space (Gray level)
- 2D feature space (Colors HS channels)
- 3D feature space (Colors RGB)
As we can see mean shift is a robust segmentation algorithm. It more efficient than k means algorithm. It provides clusters with irregular shape and its points share same attraction basin.
Demo
You can download week demo using
git clone https://github.com/sbme-tutorials/cv-week8-demo.git