Week 10: Exercises
- Image Segmentation
- Otsu Binarization
- Region growing
- Mean Shift
- Image analysis (Length, Area)
- Camera
- Coordinates
- SIFT
- Quiz 3
Image Segmentation
For Image segmentation we studied three methods
-
Histogram based segmentation (Image thresholding and binarization)
Maximize Between class variance or minimize within class variance.
-
Region based segmentation (Region or seed growing)
-
Clustering based segmentation (Mean shift segmentation)
Otsu Binarization
Histogram of a 3 bit image is shown in the following table
| Gray level | 0 | 1 | 2 | 3 | 4 | 5 | 6 | 7 |
|---|---|---|---|---|---|---|---|---|
| number of pixels | 2 | 3 | 2 | 1 | 2 | 3 | 2 | 1 |
Find optimal threshold using Otsu.
Solution
Plotting histogram
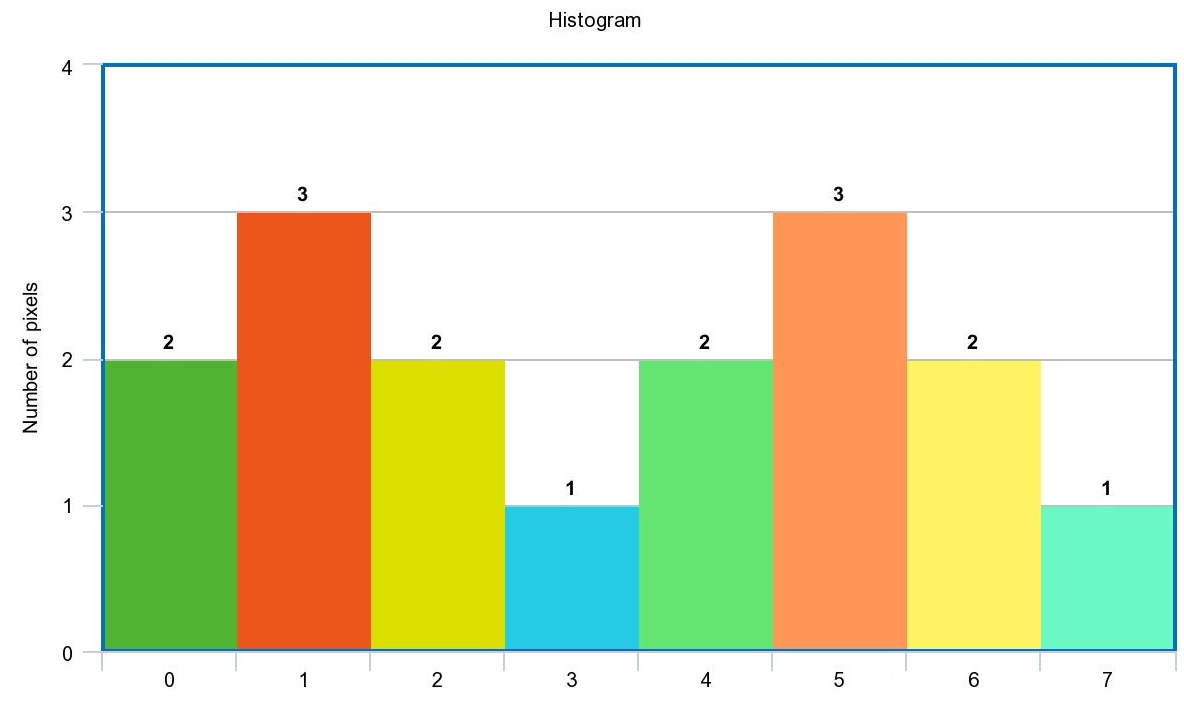
Between class variance \(\sigma_b^2\)
\[\sigma_b^2 = c_1 (1-c_1) (\mu_1 - \mu_2)^2\]It is clear that optimal threshold is 3.
\(\sigma_b^2\) at \(t = 3\)
\[c_1 = \frac{2+3+2+1}{16} = \frac{1}{2}\] \[\mu_1 = \frac{0 \times 2+ 1 \times 3 + 2 \times 2+ 3 \times 1}{2+3+2+1} = \frac{10}{8}\] \[\mu_2 = \frac{4 \times 2+ 5 \times 3 + 6 \times 2+ 7 \times 1}{2+3+2+1} = \frac{42}{8}\] \[\sigma_b^2 = 0.5 \times 0.5 (4)^2 = 4\]Let’s try t = 4
\(\sigma_b^2\) at \(t = 4\)
\[c_1 = \frac{2+3+2+1+2}{16} = \frac{10}{16}\] \[\mu_1 = \frac{0 \times 2+ 1 \times 3 + 2 \times 2+ 3 \times 1 + 4 \times 2}{2+3+2+1+2} = \frac{18}{10}\] \[\mu_2 = \frac{5 \times 3 + 6 \times 2+ 7 \times 1}{3+2+1} = \frac{34}{6}\] \[\sigma_b^2 \sim 3.5\]Optimal threshold is \(t = 3\) with maximum between class variance
Region growing
Apply region growing on the following image. Initial point at (2,2). Threshold is 2. Use 4 connectivity.
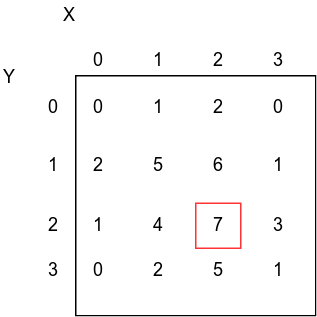
Solution
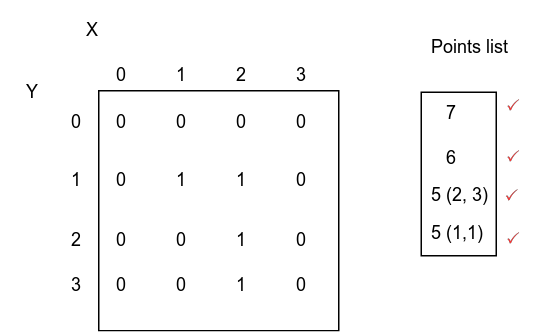
The segmented region is shown in the following figure. Condition \(\rightarrow\) absolute difference <= 2. Here we compare relative to original seed.
Thanks to Eng.Hanna Nabil.
Mean Shift
Basic steps are :
- Select a random mean.
- Get points around this mean within a specific bandwidth and multiply them by selected kernel.
- Calculate the mean of these points.
- Repeat till convergence (new mean \(\sim\) old mean) within a threshold.
- Cluster all visited points to that final mean.
- repeat till all points in the space are clustered.
Example
Points (1,2) (1,3) (1,3) (2,3) (3,3) (3,3) (4,5) (5,4) (5,4) (5,4) (5,4) (5,4) (5,4) (6, 3) (6, 5) represent the feature space apply mean shift clustering with bandwidth of 2 and flat kernel.
Solution
Plotting points in feature pace
- First trial
- Initial mean is (2, 3)
- Points in bandwidth are (1,2) (1,3) (1,3) (2,3) (3,3) (3,3)
- New mean \((\frac{1 \times 3 + 2 \times 1 + 3 \times 2}{6}, \frac{2 \times 1 + 3 \times 5}{6}) = (1.8, 2.8)\)
- Second iteration: points in bandwidth of new mean are the same point and new mean will be the same (1.8, 2.8)
- Second trial
- Initial mean (5, 4)
- Points in bandwidth are (4,5) (5,4) (5,4) (5,4) (5,4) (5,4) (5,4) (6, 3) (6, 5)
- new mean \((\frac{4 \times 1 + 5 \times 6 + 6 \times 2}{9}, \frac{3 \times 1 + 4 \times 6 + 5 \times 2}{9}) = (5.1, 4.1)\)
- Second iteration: points in bandwidth are the same point and new mean will be the same (5.1, 4.1)
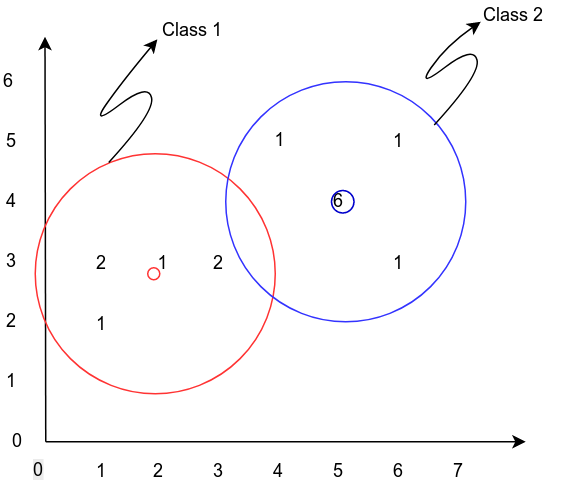
Image analysis (Length, Area)
Area
For shape with N points its area is
\[A = \frac{1}{2} |\sum_{i = 0}^{N} x_i (y_{i+1} - y_{i-1})|\]Area of triangle is with points \((x_1, y_1)\), \((x_2, y_2)\) and \((x_3, y_3)\)
\[A = \frac{1}{2} |det(\begin{bmatrix} x_1 & y_1 & 1 \\ x_2 & y_2 & 1 \\ x_3 & y_3 & 1 \end{bmatrix} )|\]Example:
Calculate the area of the following shape

Solution
We can use general equation or divide the figure into many rectangles as follow
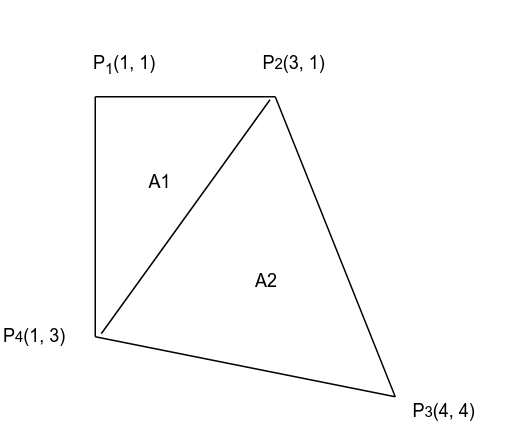
You can easily use calculator to get determinants. Total area will be
\[A = A_1 + A_2 = 6\]Camera
Pipeline
World Coordinates \(\rightarrow\) Camera Coordinates \(\rightarrow\) Image Coordinates (distorted to un-distorted coordinate) \(\rightarrow\) Sensor coordinates (CCD camera sensors) \(\rightarrow\) Memory Coordinates
Coordinates
Homogenous coordinates in 2D \(\begin{bmatrix} x \\\ y \\\ w \end{bmatrix}\) and transformation matrices. w = 0 for point at infinity and w = 1 for object coordinates (Computer Graphics)
- Translation in 2D
- Rotation in 2D
- Both
Example
points [2, 3], [3, 7] apply rotation 90 degree and translation in x direction with 3.
Solution
- [2, 3]
- [3, 7]
SIFT
Find 8 elements feature vector for following 4x4 block
\[\begin{bmatrix} 96 & 98& 127& 189 \\\ 72 & 68 & 94& 163 \\\ 69 & 69& 86& 146 \\\ 62 & 70 & 79 & 119 \end{bmatrix}\]Solution
-
Getting gradient magnitude and direction
Gx subtract in x direction.
\[\begin{bmatrix} 96 & 2& 29& 62 \\\ 72 & -4 & 26 & 70 \\\ 69 & 0& 17& 60 \\\ 62 & 8 & 9 & 40 \end{bmatrix}\]Gy subtract in y direction
\[\begin{bmatrix} 96 & 98& 127& 189 \\\ -24 & -30 & -33 & -26 \\\ -3 & 1& -8& -17 \\\ -7 & 1 & -7 & -27 \end{bmatrix}\]Gradient magnitude \(G_M =abs(G_x) + abs(G_y)\)
\[\begin{bmatrix} 192 & 100& 156& 251 \\\ 96 & 34 & 60 & 100 \\\ 70 & 1& 88& 80 \\\ 70 & 9 & 16 & 70 \end{bmatrix}\]Gradient Direction \(G_\theta = tan^{-1}(\frac{G_y}{G_x})\)
\[\begin{bmatrix} 45 & 88& 77& 71 \\\ 341 & 262 & 308 & 339 \\\ 360 & 90& 335& 344 \\\ 353 & 7 & 322 & 325 \end{bmatrix}\] -
Adjusting orientation
Quantization to Gradient direction 36 bins
\[\begin{bmatrix} 45 & 90& 80& 70 \\\ 340 & 260 & 310 & 340 \\\ 0 & 90& 340& 340 \\\ 350 & 10 & 320 & 330 \end{bmatrix}\]Dominant direction is 340 (Subtract it from gradient direction) So Gradient direction will be
\[\begin{bmatrix} 60 & 110& 100& 90 \\\ 0 & 280 & 330 & 0 \\\ 20 & 110& 350& 0 \\\ 10 & 30 & 340 & 350 \end{bmatrix}\] -
Magnitude weighted angle histogram
Quantize gradient direction to 8 bins (0, 45, 90, …) So it will be
\[\begin{bmatrix} 45 & 90& 90& 90 \\\ 0 & 270 & 325 & 0 \\\ 0 & 90& 0& 0 \\\ 0 & 45 & 0 & 0 \end{bmatrix}\]And Gradient magnitude is
\[\begin{bmatrix} 192 & 100& 156& 251 \\\ 96 & 34 & 60 & 100 \\\ 70 & 1& 88& 80 \\\ 70 & 9 & 16 & 70 \end{bmatrix}\]So Magnitude weighted angle histogram is
Angle 0 45 90 135 180 225 270 325 Sum of \(G_M\) 590 201 508 0 0 0 34 60 Relative (value/Total) 0.42 0.15 0.36 0 0 0 0.02 0.05
Quiz 3
Question 1
For The following 3 bit image
\[\begin{bmatrix} 0 & 1& 1& 2 \\\ 2 & 5 & 5& 4 \\\ 6 & 7& 6& 2 \\\ 4 & 6 & 5 & 0 \end{bmatrix}\]Between class variance for all possible thresholds is found as follow :
| t | 1 | 2 | 3 | 4 | 5 | 6 |
|---|---|---|---|---|---|---|
| \(\sigma_b^2\) | 1.5 | 2.5 | 7 | 3.5 | 2 | 1 |
-
What is the optimal threshold ?
-
Binarize the image based on this threshold
Question 2 True or false and correct
- Mean shift clustering algorithm can handle clusters of irregular shapes.
- In Otsu binarization, minimizing the within-class variance is the same as maximizing the between-class variance
- Harris operator is invariant to rotations, translations, and scale.
- Each point on a line maps to exponential curves in polar Hough Transform.
- Feature points should be geometric and photometric variant.
- For a corner point: both Eigenvalues of the H matrix have large values
- H matrix is computed using the gradients of the image.